Creating Social Impact with Swim Guide – Presentation at the GTEC Conference


On October 20, 2015, I presented Swim Guide at the Social Impact as a Platform for Innovation panel at the 2015 GTEC Conference in Ottawa. The panel focused on opportunities for social innovation when non-profit, private, and government sectors work together through Open Government initiatives. Swim Guide was one case study showing how such an integration can address a social need.
This is what I presented.
Slide 1 - (Swim Guide logo)
Transition Slide
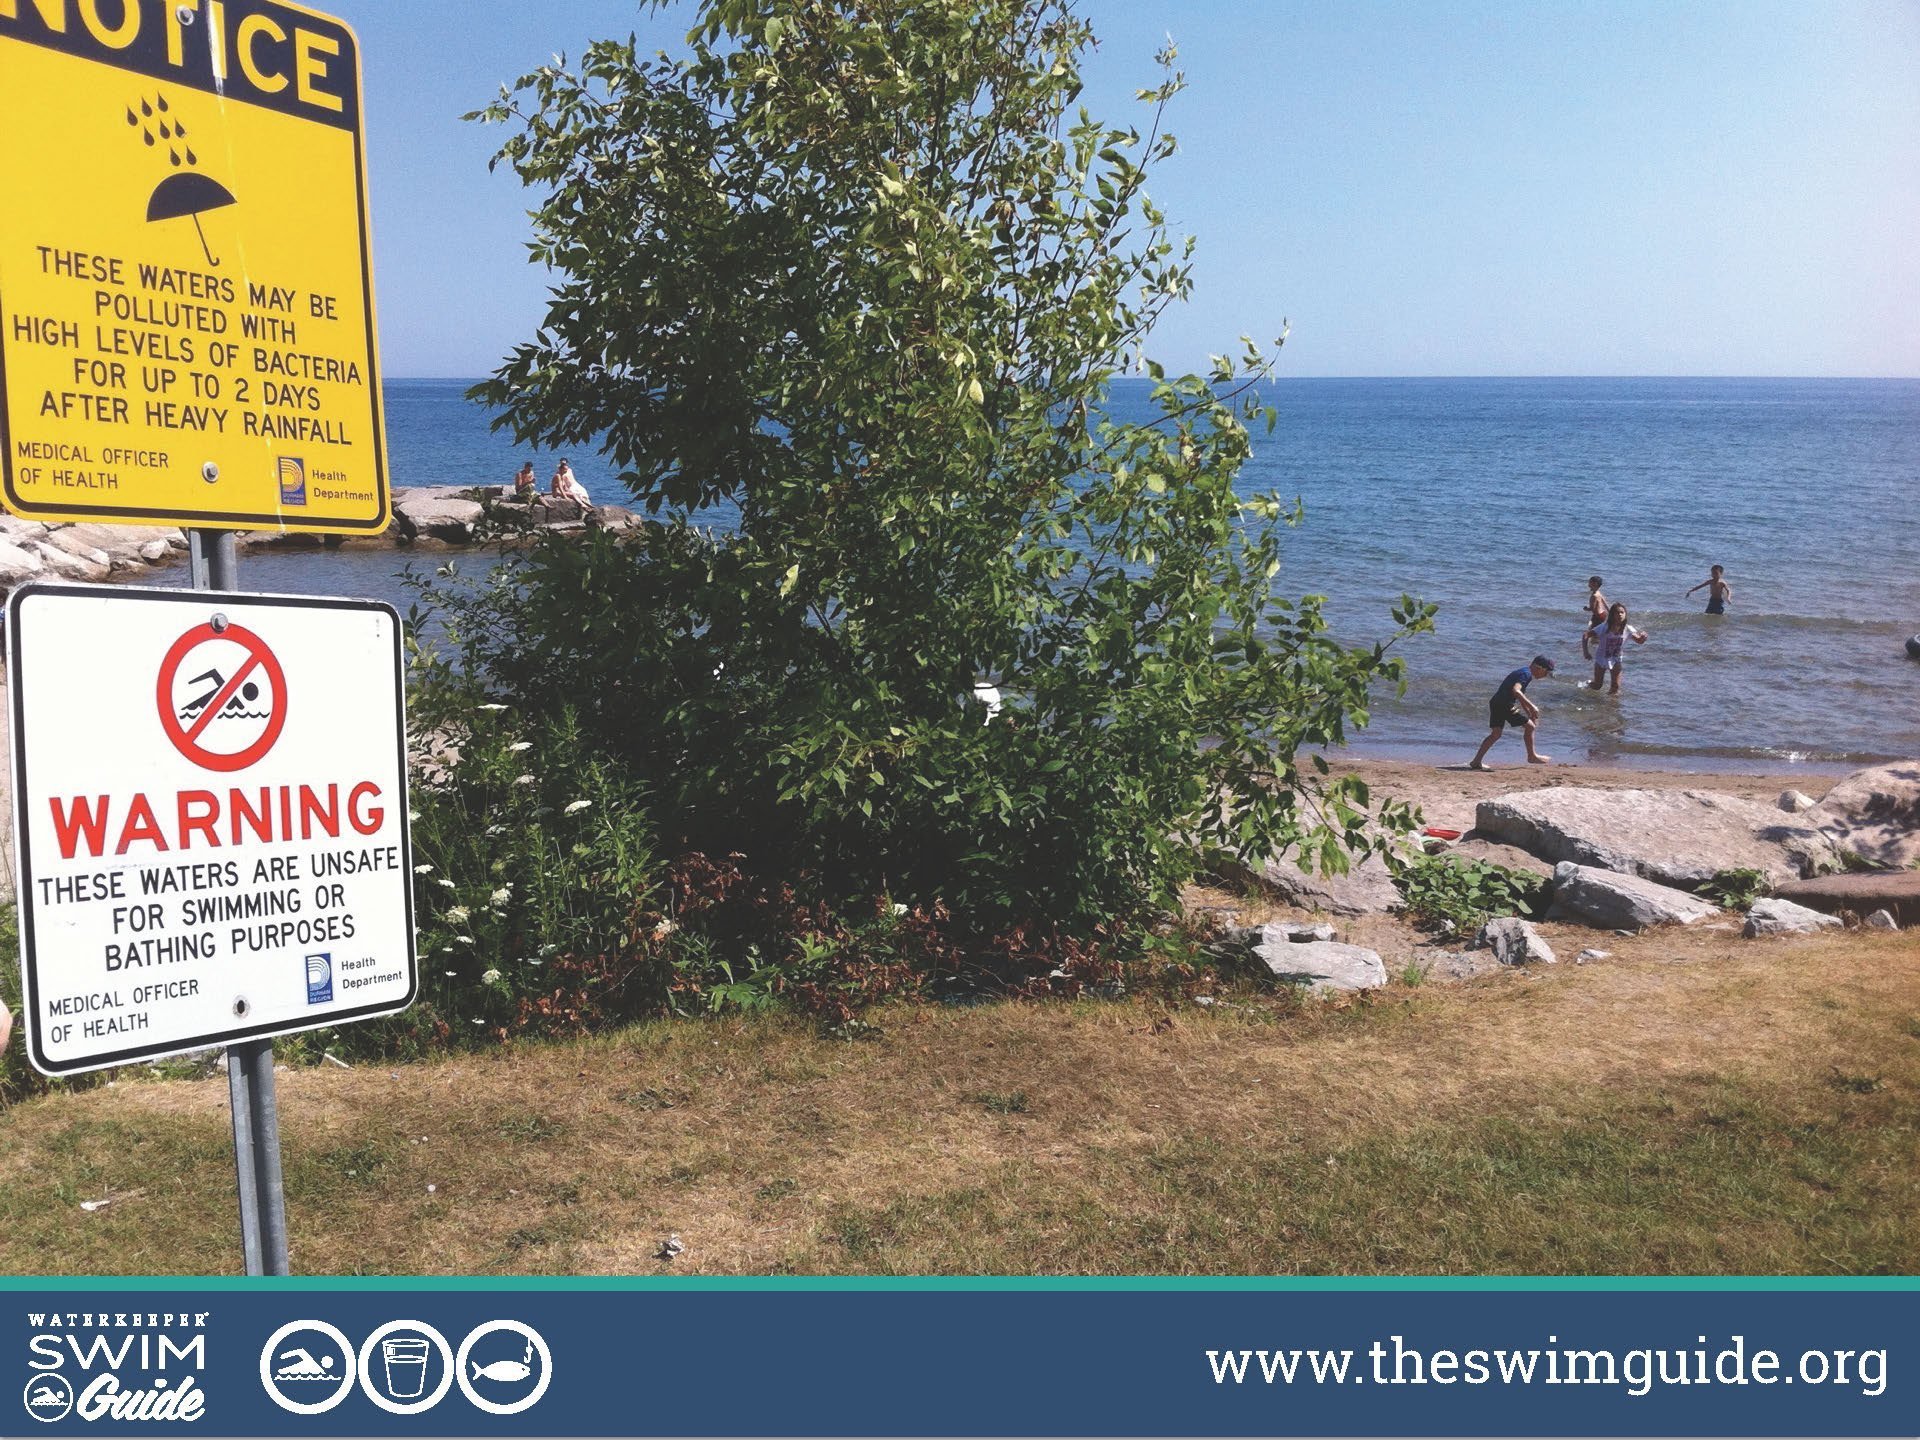
Slide 2 - (Beach Closed - Oshawa)
Imagine this. You pack a picnic lunch for your family. Hustle your kids into the van. You drive 30 minutes to your closest beach. And it’s closed.
Or worse - you get to the beach. You swim in it because you don’t know that there are elevated levels of bacteria. And you get sick.
Or worst of all - you never spend time by the water at all. Because you don’t even know you can.
That last one? That was me, for the first 22 years of my life.
And I’m not the only one.
Slide 3 - Beach Closures / Barrier Stat
1 in 5 Canadians head to the beach each year only to find the waters aren’t clean enough to swim.
That’s why we at Waterkeeper created Swim Guide.
To help the 80% of Ontarians who are inconvenienced by beach closures each year find the cleanest beaches.
To help the millions of North Americans who get sick each year after swimming in polluted waters.
To help the local business that lose $50 per beach goer per day every time a beach is closed because of poor water quality.
And most importantly of all, to improve quality of life for each and every person who lives, works, or plays on the water.
Slide 4 - Swim Guide Screenshot
So what is Swim Guide? In a nutshell, it’s a website and a smartphone app that shows you the beaches closest to you. It shows you current recreational water quality, where available, as well as a historical average.
Slide 5 - Beach Manager
How does it work? Each day during the swimming season, Lake Ontario Waterkeeper and our 60 affiliates go into our Beach Manager tool and indicate which beaches meet water quality standards for their jurisdiction, fail to meet standards, or have no reliable information available.
They use monitoring data from the samples they collect themselves, or they get it from government sources. We use information from hundreds of government agencies, making Swim Guide one of the largest clearinghouses for beach water quality information in the world.
Slide 6 - Growth
Since we launched in 2011, Swim Guide has had 560,000 users. We’ve added 7,000 beaches to the system. And we’ve become the most comprehensive beach information service on the web.
Swim Guide is more than an app. It’s also a platform for community organizations trying to improve access to clean water.
And Swim Guide is a cultural movement. It’s a signal that people want swimmable water, that they expect swimmable water, and that they want to be involved in the discovery and stewardship of their recreational waters.
So, why did we make it?
Slide 7 - Data Barriers
We created Swim Guide because the public had four important challenges.
- Lack of data. People wanted information about beach water quality that just wasn’t being shared with the public. Monitoring was happening, but no one was communicating the results to the people who actually go to the beach. We made phone calls - hundreds of phone calls - and the data started to be released, because we showed government the demand.
- Finding data. Sometimes the information exists, but the public can’t find it. It’s buried on obscure government websites, published in terms that are different from normal search queries, or recorded on hotlines that you have to know exist to use. We navigate the system to make the information easier for people to access.
- Finding data when they need it. Annual reports are no good on a Saturday morning in August when you want to know if you can put your toddler into the lake that day.
- And understanding data. You can call one beach hotline on the Great Lakes and be told that your beach is “400” today. That’s accurate, but to know what it means, you need to know that it represents a bacteria count, and you need to know that anything over 100 is considered unsafe. Most people don’t know that.
So Swim Guide collects, synthesizes, and shares information the public wants when they want it, in a format they like to use. And because we’re a nonprofit, we are able to do it across jurisdictions.
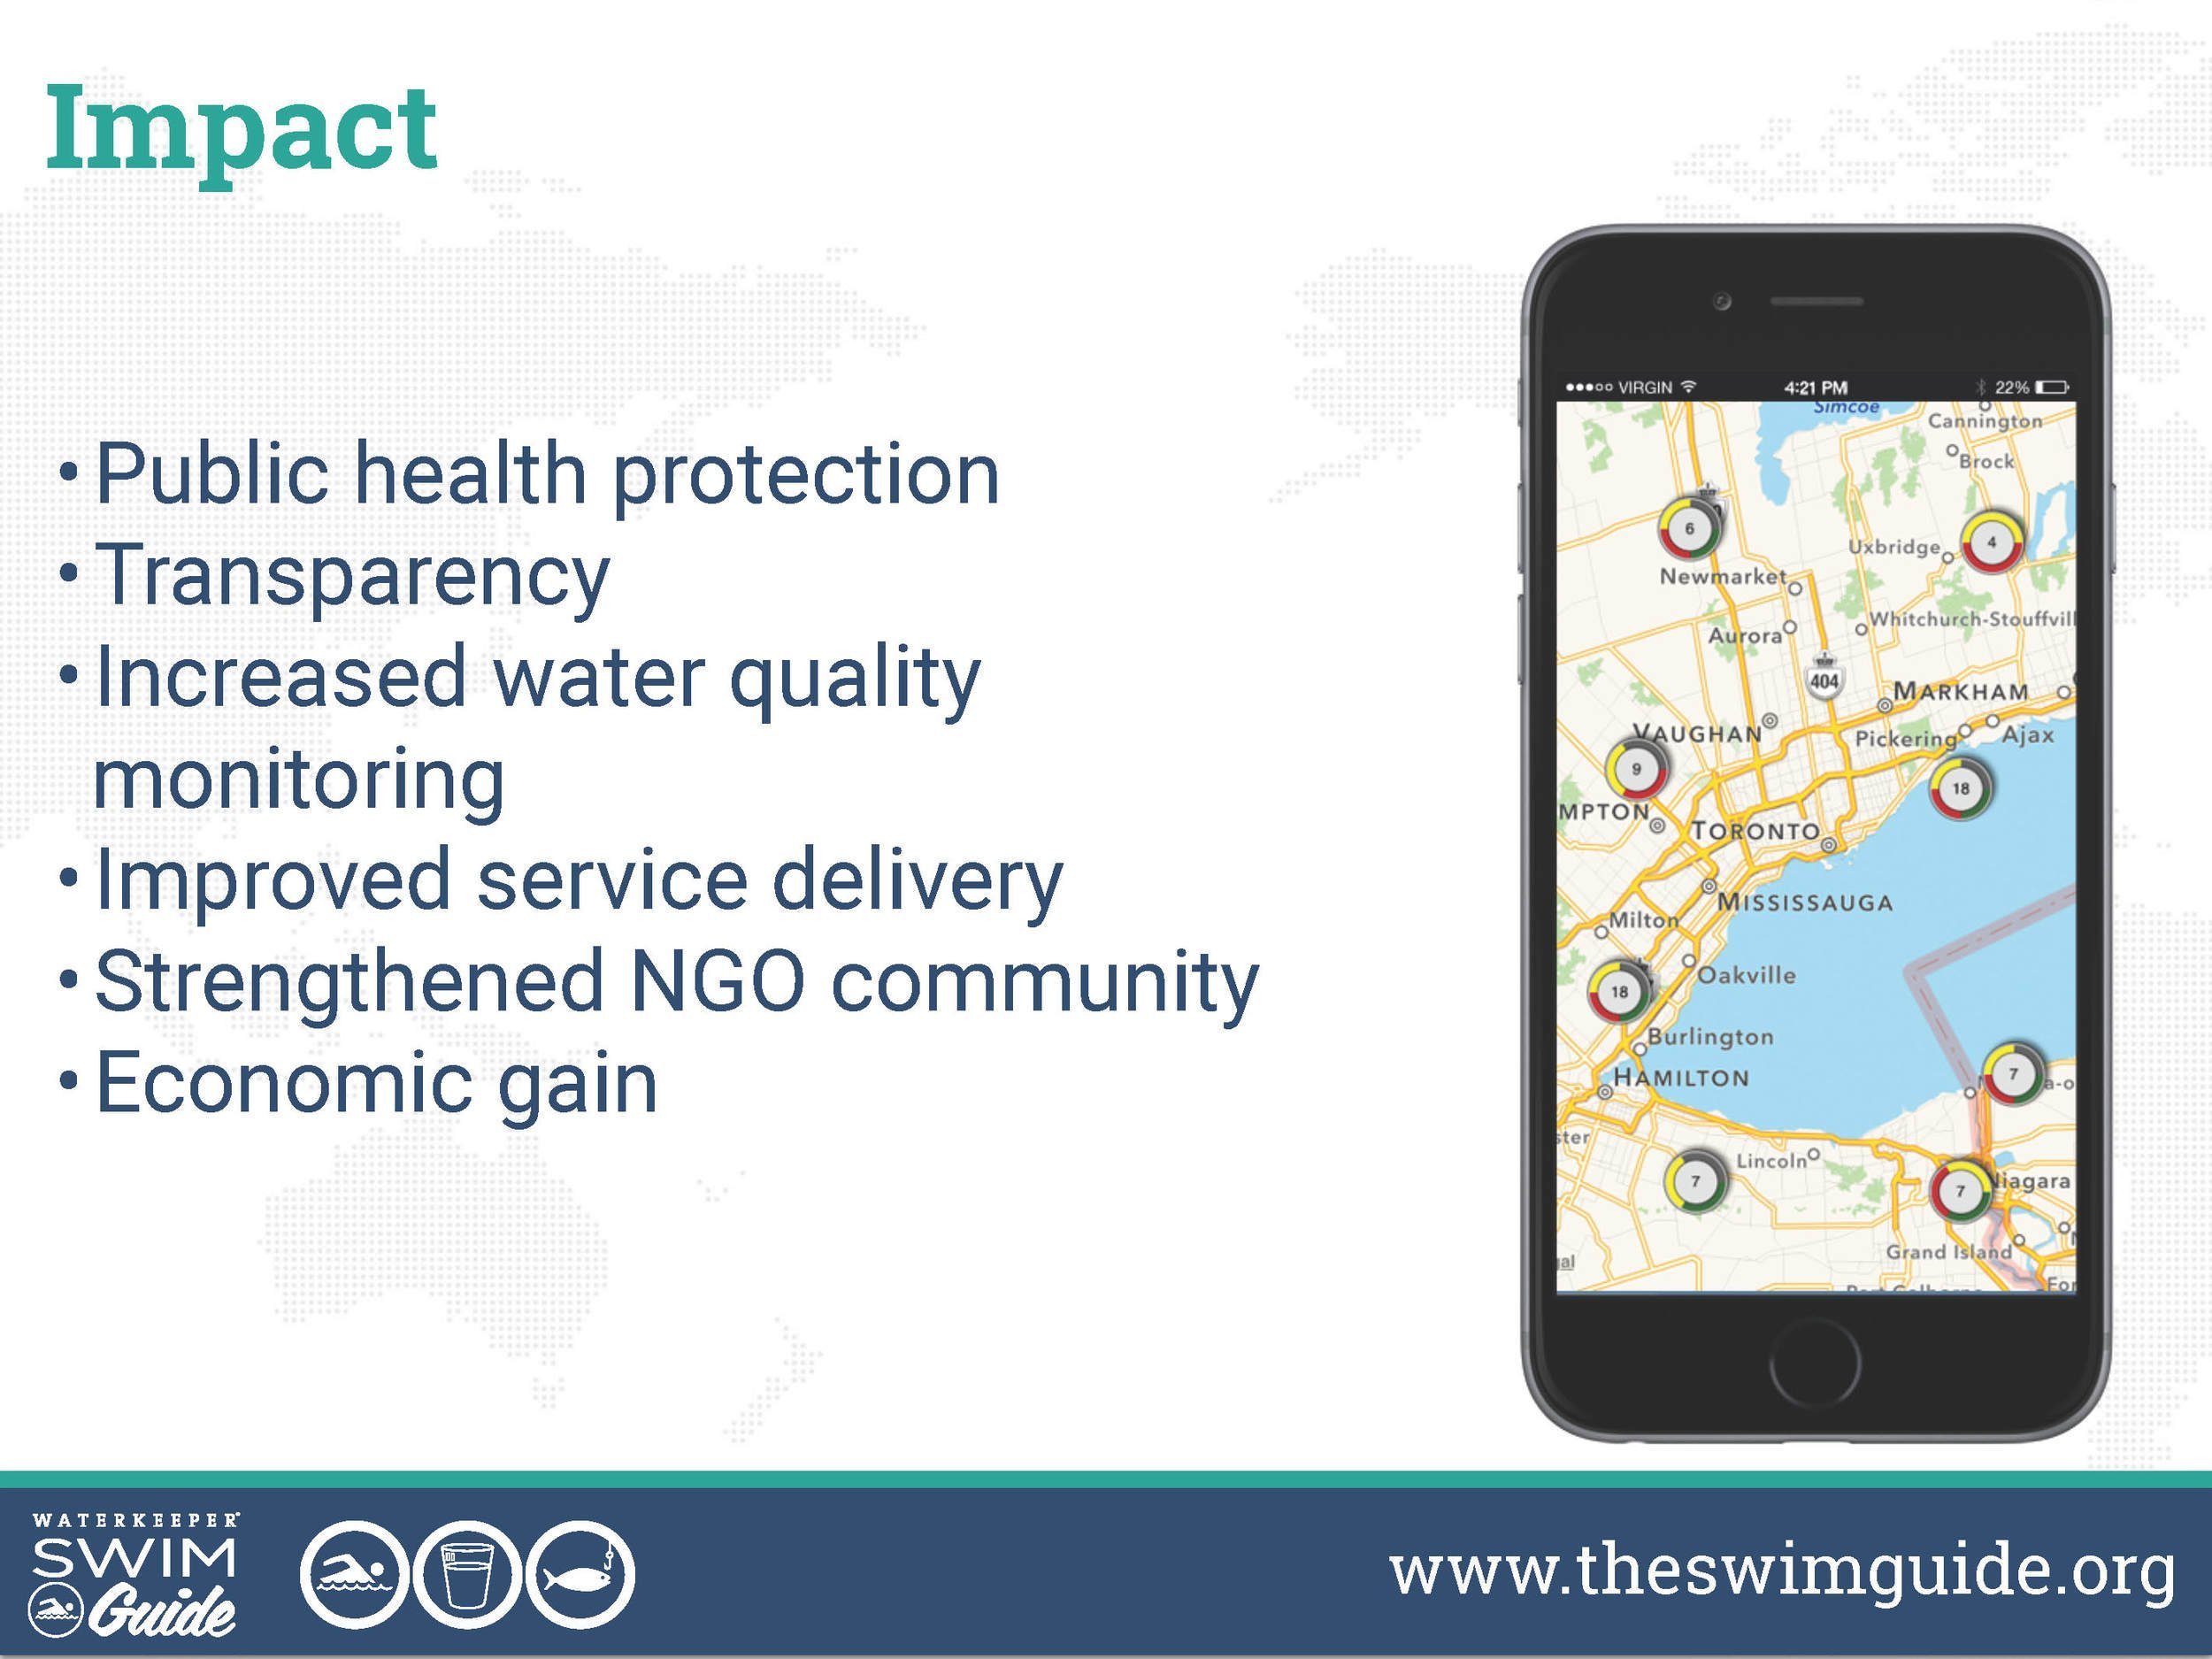
Slide 8 - Impact
The impact is incredible.
Swim Guide prevents tens of thousands of waterborne illnesses each year, because our users can easily find beaches that meet water quality standards.
It increases transparency by encouraging the release of water quality information. I can list more than 100 beaches that were monitored but not shared before Swim Guide came along.
It increases the number of beaches that are monitored, because government agencies and nonprofit organizations use the platform to gauge public interest in their programs and respond accordingly.
It strengthens the NGO community, by providing a program model that allows organizations to promote clean water, deliver their sampling results to thousands of users, and improve their understanding of the facts about beach water quality.
And let’s not forget the economic benefit. We know that beach goers spend an average of $50 per person per day - when the beach is open, when people aren’t afraid.
That’s the power of data.
Slide 9 - Report Card
So how are we doing with data sharing right now? I’d say a C, with great improvement over the last two years. Ontario, in particular, has a robust water quality monitoring program. The work is being done on the ground, in most cases, but the information often sits in silos.
When it comes to dialogue, I’d say “D”. Swim Guide is one example of a huge resource generated outside of government, but government doesn’t show interest in the tool. Nonprofits are at the bottom of the list when it comes to consultation and dialogue, and I think we can change that.
And when it comes to open data - machine readable data - that doesn’t exist yet except for in a few rare instances.
But let’s talk about where we’re headed.
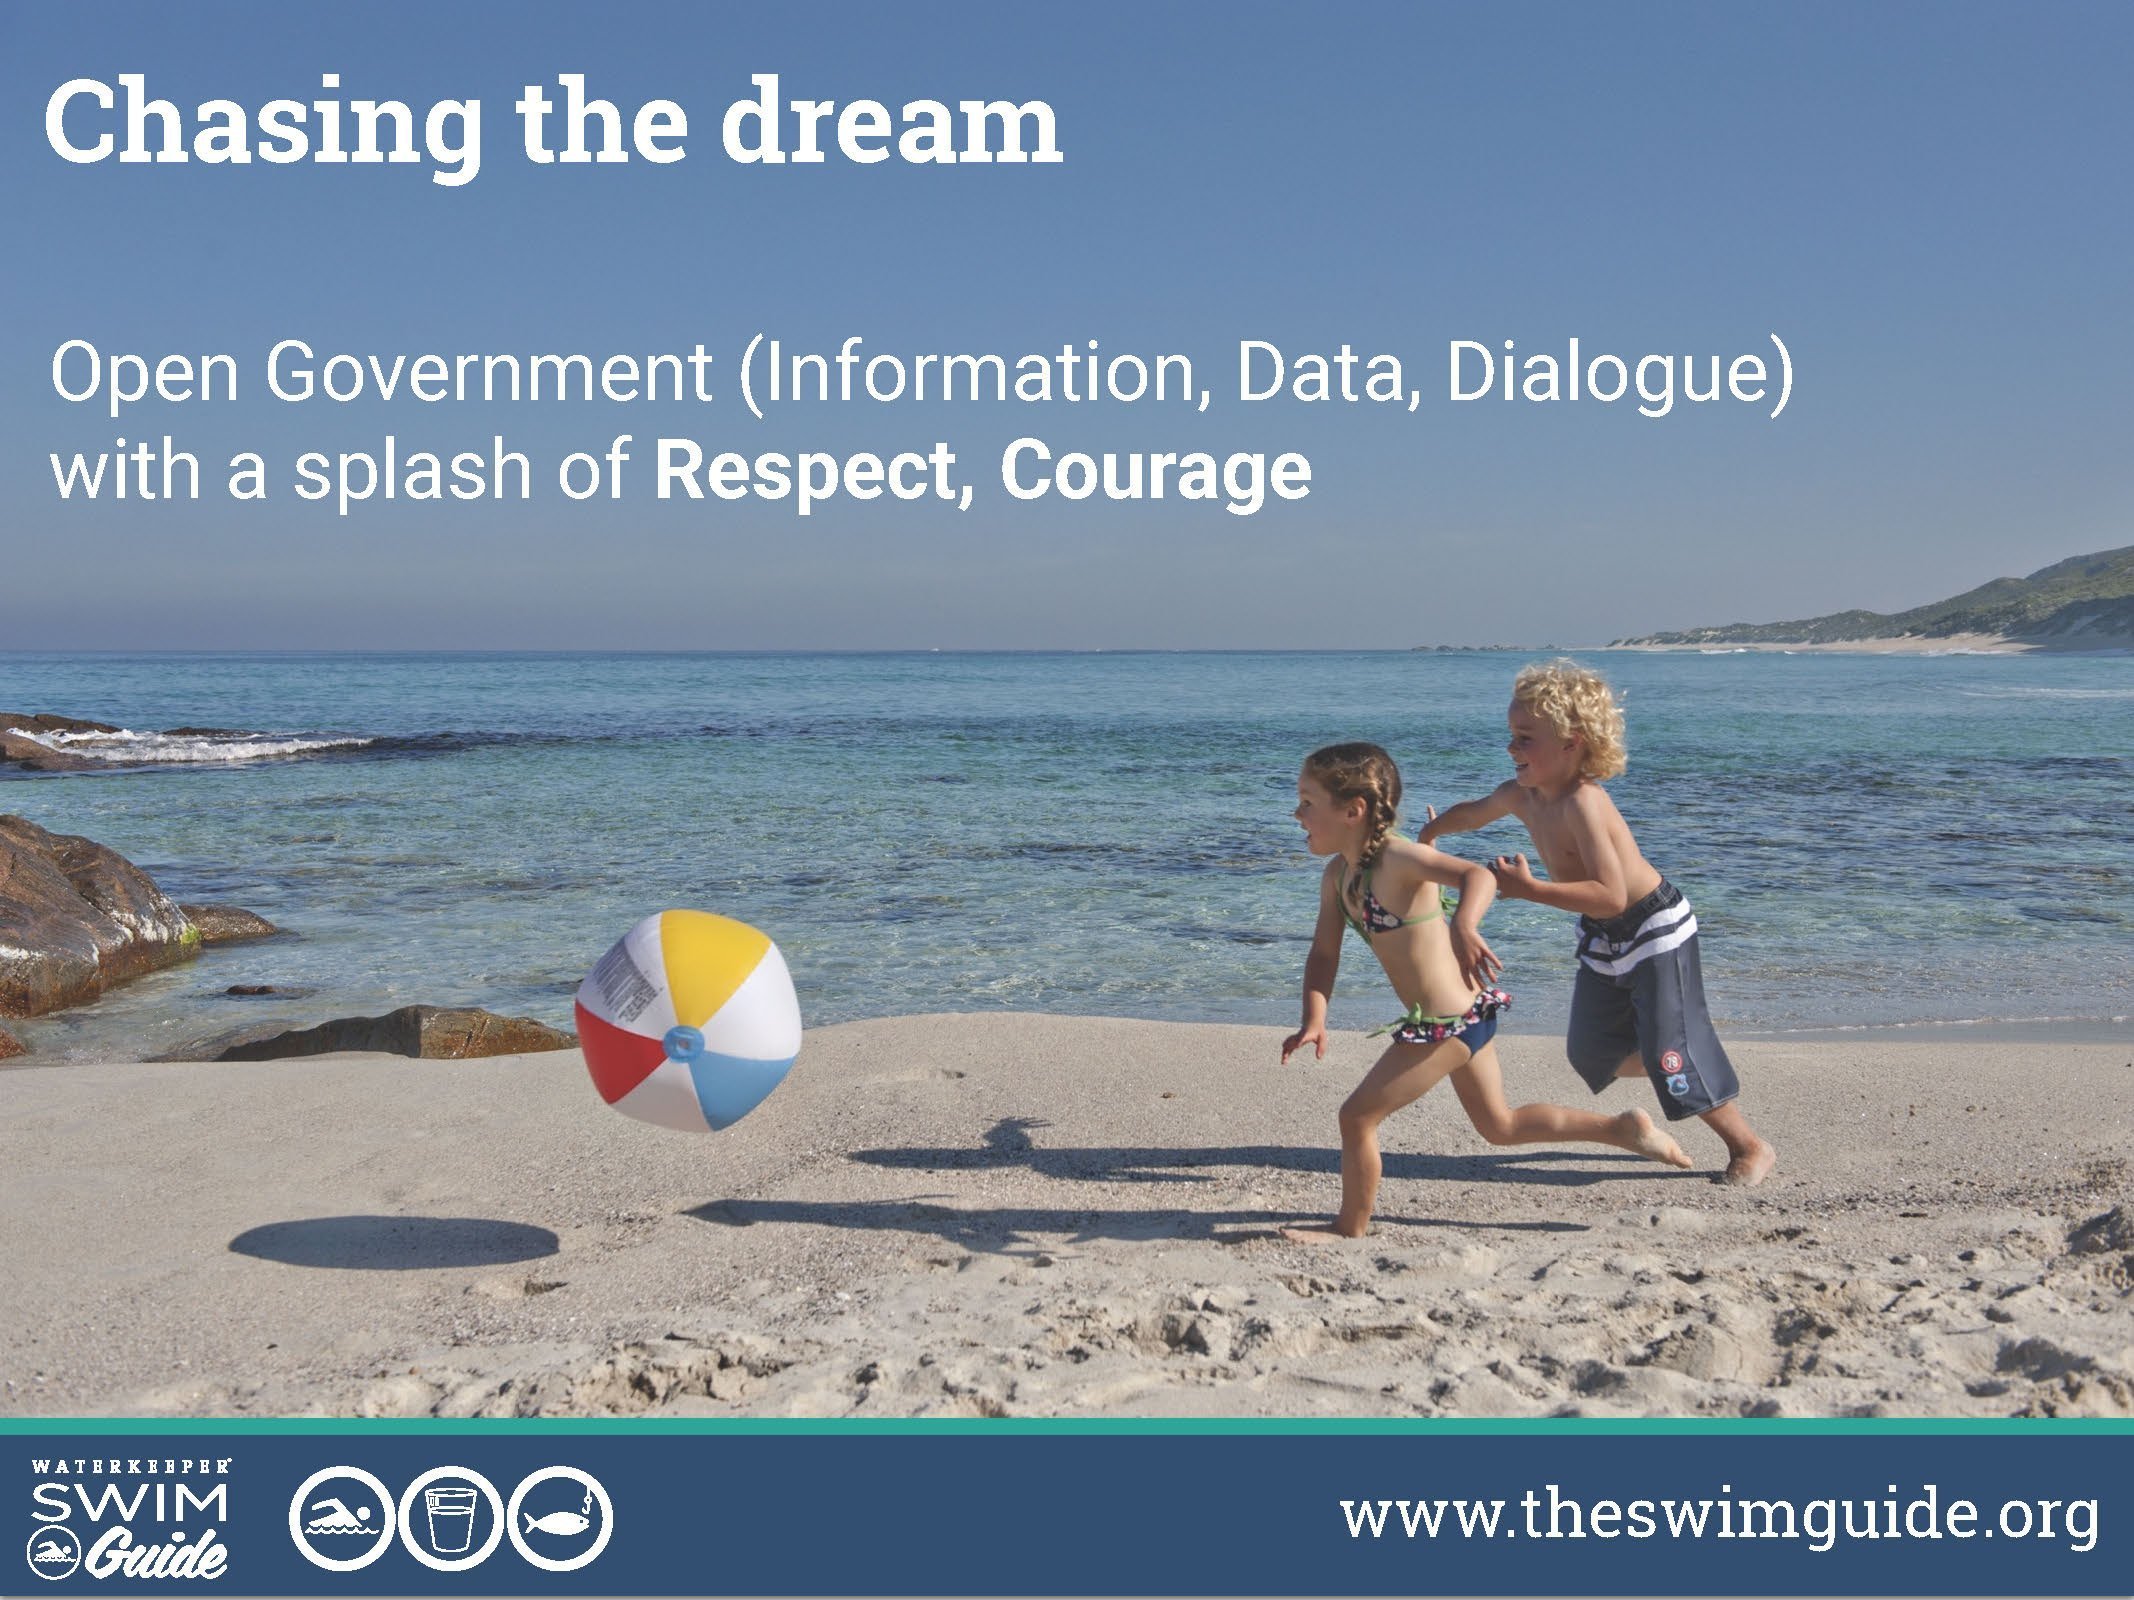
Slide 10 - Principles
The principles of Open Government include Information, Data, and Dialogue.
I have two more to add: Respect, and Courage.
Respect means respecting that the public needs the information government has, that nonprofits are capable partners government can work with, and that innovation can - and should - come from all sectors.
Courage means having faith that releasing data to the public is the right thing to do - even when we don’t like what it says. Better data sharing means more people know when the beach is polluted. That’s scary.
But it’s worth it.
Slide 11 – Defining "Open Government"
For me, open government means:
- physical health
- mental health
- environmental health
- better return on investment for remediation projects because we start with the places people need the most
- micro economic benefits, that local spending macro economic benefits, because the tools we build start Canadian values - like clean water - and strengthen help develop an information economy
Yes, it’s worth it.
Slide 12 - Thank you
So thank you for letting me share the Swim Guide story today. Obviously, it’s my passion. But we are also just one NGO of many, one data sharing project of several. Which is why this session at GTEC today is so important.
#GTEC #SocialImpact speakers @FociSolutions' Shan Gu, @RightToPlayIntl's @tinat880, @swimguide's @krystynt #GTEC2015 pic.twitter.com/vDiq4Vmi12
— Lake On. Waterkeeper (@LOWaterkeeper) October 20, 2015