
Section 3:
Introduction to Field Work
Introduction to Field Work
Now that you have planned your monitoring program, you’re ready to start your field work! Field work is one of the most important steps when establishing your monitoring hub. This section will cover customizing your field sheets and the proper protocols for working safely in and around water. We will mainly cover how to collect samples and chemical parameters to ensure that your final data is accurate and authentic.
For more information review the Standard Operating Procedures document.


Customizing Field Data Sheets
The field data sheet is used to record environmental and debris observations, sample times, and chemical results. The “Field Data Sheets” template can be edited to design a general document for use at each of your sampling sites. Must be completed before sampling starts.
Customizing Field Guide
The field guide template is a document that explains to the user about the different aspects associated with each sampling site. The “Field Guide” template can be edited to design a general document for use at each of your sampling sites. Must be completed before sampling starts.
This document contains a comprehensive list of all the items you may be bringing with you into the field for monitoring. We find this list helpful to print out and put on the wall of our lab so we ensure we don’t forget to bring anything with us. You can edit a template version of this list by editing the '“Kit List” template. Must be completed before sampling starts.
Preparing your Field QA/QC
Quality assurance and quality control (often abbreviated QA/QC) is the overall management system of a sampling program, which ensures the production of reliable and accurate data. Variability occurs naturally in water bodies but is also introduced during the collection and analysis of samples from these waters. QA/QC decreases the variability/ bias in a monitoring program and creates high quality data that may be accepted in the court of law, in scientific studies, or in compliance with the goals of your monitoring program.
Calibrating your equipment and preparing field, duplicate, and temperature blank samples are amongst the QA/QC plan. View the SOP for a full explanation on the QA/QC and edit the documents to the RIGHT to reflect your monitoring plan.
Labelling Samples
Sample labels are used to assure accurate sample identification throughout water sampling and analysis and is a form of quality control. Typically, sample labels are written on the front of whirl packs to ensure that samples are taken accurately. These sample labels are then used throughout the monitoring, processing, and analyzing stages of sampling to maintain strong quality control. The chart (RIGHT) details how to establish your own set of sample labels for each sampling site, going over each section of the label in detail. Review the Standard Operating Procedures to establish what stages of the monitoring process will utilize monitoring labels.
Preparing for Field Work
Now that you know the who, what, where, when and why you’re monitoring, it’s time to prepare all the documents you’ll need to execute your work! You can download or open links to templates of these documents and customize them to suit your monitoring program. If you have any questions about these documents, you may wish to refer to our Standard Operating Procedures (SOP).
Preparing for field work involves the development of several documents that will be used throughout the monitoring process. These include: field data sheets, field guides, kit lists, QA/QC information, and sampling labels. As well, it involves preparing your QA/QC materials prior to beginning your sampling day. It is important to develop these documents before you begin monitoring at any of your sampling sites.
Visit the Standard Operating Procedures document to learn more about how to prepare documents and materials for field work.
Download the Field Data Sheets
Download the Field Guide Template
Customizing Kit List
Download the Kit List Template
Download the Duplicates Sheet
Download the YSI Calibration Guide

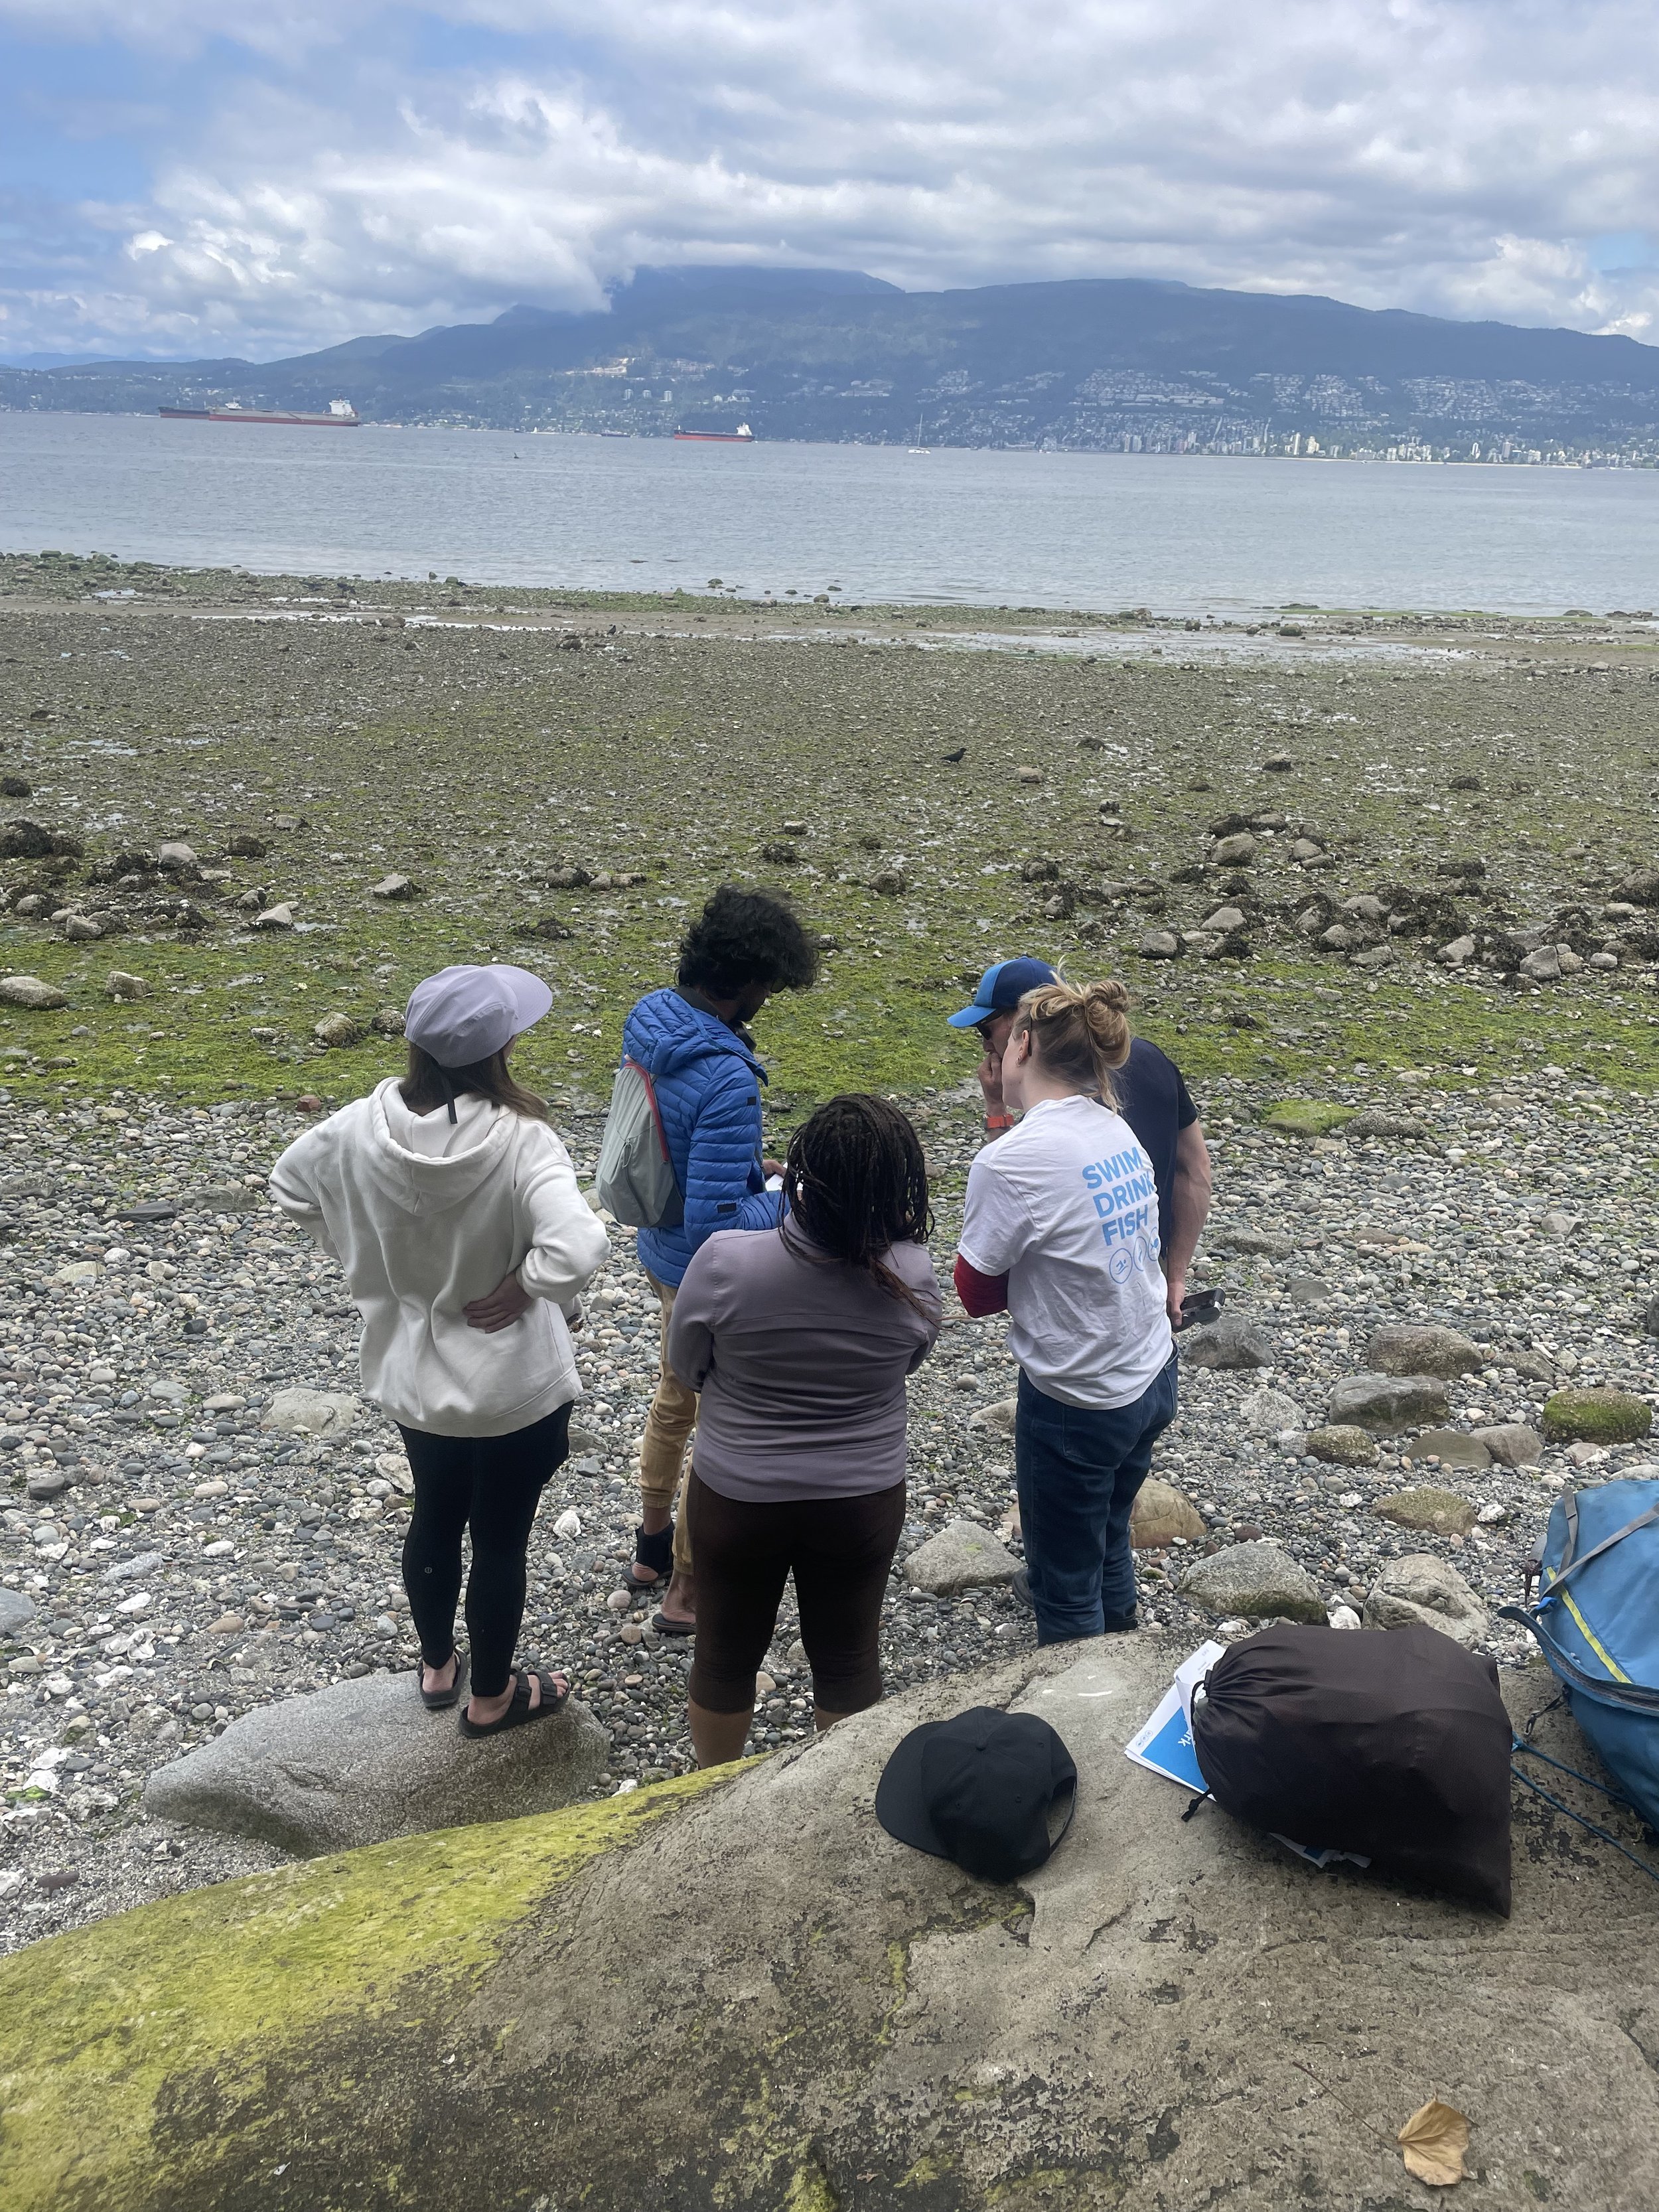
Field Work Safety
When working in and around water there are physical, chemical, and biological risks that you should be aware of. Steps should be taken to mitigate these risks in order to complete the sampling safely. Remember, if at any time you are uncomfortable entering the water please do not enter it. Always remember to be safe and use good judgment. We do not recommend being in and/or around water alone.
Below is a list of risks that can be associated with sampling and ways to mitigate those risks through personal protective equipment (PPE) and standard procedures when entering and engaging along the shoreline
Physical Hazards and Risks
Below are some of the physical risks associated with sampling:
Uneven ground
Wading into the water
Sampling off of docks
Ice and snow covered ground and docks
Large waves
Sharp debris and waste on the ground and in the water
Weather Associated Risks
Below are some of the weather risks associated with sampling:
Sun exposure
Heat exposure
Cold exposure
Extreme weather
Thunderstorms and lightening strikes

Biological/Chemical Risks
Below are some of the chemical and biological risks associated with sampling:
Bacteria and microorganisms
Oil
Gasoline
Needles and syringes
Special Considerations
Below are some special considerations to be aware of during the sampling process:
First Aid
Comfort around the water
Swimming abilities
Debris in the area
Do not sample alone when working around the water
Seasonal variations
For a full list and descriptions of all the items associated with field work safety when sampling, visit the physical Standard Operating Procedures document.
Collecting Samples and Physical/Chemical Information
Now that you have customized your field documents and have an understanding of the potential hazards and safety risks associated with water sampling and monitoring, you can begin to take your samples. Monitoring includes collecting three types of data: water sample data, QA/QC sample data, and physical/chemical data. Water samples are primarily used to track the E.coli and Total Coliform levels at a recreational beach. QA/QC samples are used to ensure the validity and authenticity of the water sampling methods and techniques being used so it is evident that the final water quality results are trustworthy. Finally, collecting physical/chemical information will include an additional range of samples that can act as an early warning indicator of issues in a water body and potential changes to the sampling site’s water quality.
For more information on each of the subsections in this section, detailed overviews are provided in the Standard Operating Procedures document. Additionally, the provided videos act as a secondary visual and auditory source of training that can provide a better idea of the outlined content.
Taking Water Samples
This video will show you how to collect your 5 samples for recreational water quality (e. coli). The video demonstrates collecting samples by wading into the water, however, there are several different ways to collect a water sample, such as using a pole or off of a dock. The Standard Operating Procedure document addresses these methods in further detail.
The following are written instructions to guide the water sampler through collecting samples.
Put on the appropriate PPE. You should’ve decided what PPE you need when designing your monitoring program. This may include: Gloves, Waders/water shoes, PFD, etc.
Using the map of your sampling locations in your Field Guide, walk to your first sampling location (location A).
Take out the Whirl-Pak that is labeled for your first monitoring location (e.g. Location A), thermometer, and hand sanitizer, and the Whirl Pak labeled for your temperature blank.
Sanitize your gloved hands.
Carefully wade into the water to a depth of 0.5m-1m (knee to waist) deep. If you’re sampling from a dock, lay down on the dock at the sampling point.
Try not to disturb the sediment. If the sediment is disturbed, wait until the sediment settles.
Take the surface temperature of the water at this location using your thermometer.
Tell your sampling partner to fill in the temperature in the chain of custody portion of the Field Data Sheets.
Take out your labeled Whirl-Pak.
Pull the side tabs to open the Whirl-Pak. Avoid touching the inside with gloved hands.
If the inside of the Whirl-Pak is touched, it should be disposed of and a new bag used.
Submerge the Whirl-Pak 0.15-0.30 m below the surface. Move the vessel horizontally in the direction it is pointed to aid in filling the bag.
Aim to fill the Whirl-Pak between the 100 mL and 118 mL line.
Hold the Whirl-Pak by the wire ends and whirl it at least 3 times. Ensure that there is a head space (air) in the Whirl-Pak. Twist the two wire tags downwards and firmly together.
Invert the Whirl-Pak to ensure that there are no leaks.
Tell your water sampling partner that you have finished taking the sample so that they may record the time on the sample collection datasheet
Exit the water
Place the sample vessel upright into the sample storage container inside the cooler. Samples should not be put directly against the ice or ice packs.
Since you have just collected the temperature blank, initial the top of the sample collection datasheet to confirm you took the temperature and temperature blank at the same location
Check your first QA/QC checklist box
Taking QA/QC Field Samples
At some sites, you’ll have to collect samples for quality control and Quality assurance purposes. In this video, we’ll review what those samples are, why we collect them, and how we collect them.
We recommend watching our video on how to collect a water sample before you watch this video. For more information on QA/QC samples, you can refer to Chapter 8 of our SOP.
The following are written instructions to guide the water sampler through collecting Field QA/QC Materials.
Collecting Physical/Chemical Information
The physical/chemical water quality information should be completed at the same sampling location each time your monitor. Choose one monitoring location that makes sense to you, and only collect physical/chemical information from here. You should note this site on the map in your field guide.
There are two ways of collecting this information that we will review: YSI sampling and Water Rangers Test Kits. YSI sampling in the field is easy. Simply turn it on, put the probe in the water, and read out the information to your sampling buddy who can record it on the field data sheet. Water Rangers Test Kits will be review in-depth below.
Temperature Blank
Fill a labeled sampling vessel with water from the first sample site. If you are sampling multiple sites in one sampling day, you only need to collect one temperature blank per cooler.
Keep the temperature blank off the ice until you start collecting samples. Temp blank should not be placed on the ice ahead of the samples, as this can give an inaccurate representation of the sample temperatures.
Do not open the sample again until processing samples in the laboratory.
See the Laboratory Processing section of this SOP for next steps.
Field Blank
Fill a labeled sampling vessel with deionized or distilled water before leaving the laboratory, using sterile instruments such as a pipettor.
Seal sampling vessel tightly and bring it into the field with you.
When in the field, open up the sample and expose it to the elements, then handle it in a similar manner as a genuine sample.
Do not open the sample again until processing samples in the laboratory.
See the Laboratory Processing section of this SOP for next steps.
Duplicate Sample
Use your copy of the Duplicates Sheet to randomly schedule your sample duplicate collections. This should be ~1 in every 10 samples.
Label the sample vessel according to the duplicate sampling location for that sampling day.
Take a duplicate of the original sample within 2 minutes of the first sample.
Follow section Sample Collection Procedure for the proper water sampling technique.
See the Laboratory Processing section of this SOP for next steps.

pH Test Strips
Open the water test strips bottle by flipping open the cap and shake out one test strip into one of your hands. Close the bottle. Using the other hand, grab your sample container.
Wade into the water until you are between knee and waist deep.
Wait for the water to settle.
Scoop up water from at least 10 cm below the water surface using the water test container.
Dip the test strip in the water for 2 seconds.
Remove the test strip from the water in the test container and hold it level for 20 seconds.
Compare the colour of the test strip to the colour chart on the back of the test strip container to determine levels of alkalinity, chlorine, and pH and hardness.
Record the value in the physical/ chemical water quality information on the Field Data Sheets
Secchi Disk
A secchi disk is a 20 cm wide disk with alternating black and white quadrants. The disk is attached to a long, flexible measuring tape.
Measure depth: lower the secchi disk into the water until it reaches the bottom of the waterbody. The ruler measures the length of this depth to the water surface, providing a measurement for water depth.
Measure clarity: Lower the secchi disk into the water until it disappears. The ruler measures the length of this depth to the water surface, providing a measurement for clarity.
Record the values in the physical/ chemical water quality information on the field data sheet.
Salinity and Conductivity
Salinity and conductivity are measured using similar instruments and methodologies. Salinity is for saltwater whereas conductivity is for freshwater. Watch this video from water rangers explaining how to use a conductivity meter to test conductivity.
Collect a water sample using a sample container.
Turn on the salinity/conductivity meter.
Place the salinity meter in the water for 15 minutes. If you are measuring conductivity place the conductivity meter in the water until the value stabilizes (approximately 60 seconds).
Record the value.
Record the value in the physical/ chemical water quality information on the field data sheet.
Dissolved Oxygen
Open the Dissolved Oxygen test kit container.
Remove an ampoule from the pack and hold onto it with one of your hands. Take out the sample container.
Notice the white tip on the ampoule. This is a weak point in the glass. Notice the ridges in the bottom of the sample container. We’ll be using both later to remove the tip of the ampoule.
Take a water sample as far below the surface as you can reach. It is more important to get the sample quickly than to get exactly to 25mL. Do not shake water samples because this can impact the accuracy of our test results.
IMMEDIATELY put the ampoule, tip down, into the water sample. Break the ampoule tip off by stationing it in one of the ridges at the bottom of the sample container then pressing down and pushing inward at the same time.
The ampoule will fill with water. Once mostly filled, remove the ampoule from the water sample and invert it. Watch the air bubble travel from one end to the other. Do this twice (invert and watch).
Hold the tip of the ampoule facing upward and start a timer for 2-minutes. The sand timer included in the kit is for 2 minutes. Start it by turning it upside down.
Take out the comparison chart. To take out the chart, pull from the bottom. To put it back in, position it under the top lip first and press downward.
Compare the colour of your ampoule to the chart by moving left to right and decide which colour matches the best.
Record the number found below the colour that matches best on the Field Data Sheets. If it’s between two values, record the halfway point. For example, if the sample falls between 8 and 10, record the number 9.
Dispose of all waste in a sharps container.

Collecting Field Data
While monitoring your sample site you will need to complete several sections of your field data sheet to ensure authenticity and potential hazards in your zone of influence. This section will provide an overview of how to collect data and fill out your field data sheet. It will detail:
Completing the Chain of Custody
Completing Environmental Observations
For more detailed information on the explanations in this section, review section four of the Standard Operating Procedures document.
Completing the Chain of Custody on the Field Data Sheet
The purpose of a chain of custody form is to provide authenticity to the data in a court of law. The documentation in the form shows that the evidence (in this case, water samples) was in the custody of a person designated to handle them at all times and that it was never unaccounted for. Sample custody must be traceable at each step from sample collection to disposal. It is helpful to minimize the number of people handling samples.
A sample is under custody if:
It is in the individual’s physical possession;
It is in the individual’s view, after being in their physical possession;
It was in the individual’s physical possession and is secured to prevent tampering; or
It is placed in a designated secure area or secured in an area restricted to authorized personnel.
Some notes when filling out the chain of custody so that the information may be admissible in court:
Make sure you cross out mistakes with one line through it and place your initials next to the line. Then write the correction beside it.
If the correction is made at a later date, put your name and initials next to it.
Chain of Custody - Part 1
Now you may start filling out the chain of custody form:
Fill in the Survey start time
Decide who will be collecting the water samples that day and fill in their name in the “samples collected by” field.
You’ll continue filling out the chain of custody when you’ve completed your monitoring session. The chain of custody is only complete once samples are processed at a lab.
Chain of Custody - Part 2
Once you have collected all of the data and completed all of the observations, you are nearly finished with your sampling day. Mark down the the following information in your chain of custody to finish up at the monitoring site:
Survey end time
If you’re handing off your water samples to a new person, you’ll fill out the ‘Relinquished by’ and ‘received by’ sections with the names of the person relinquishing the samples and the name of the person receiving them. You will only fill out this section here if you’re passing samples off before samples reach the lab- we recommend limiting the number of people handling samples overall.
Completing Environmental Observations
If you are collecting data on wildlife, trash, and water users, review this section. For these environmental observations, it is recommended that all observations occur within the site boundary. Further, dedicate one observer for each section from start to finish. This prevents double counting or miss-counting.
Wildlife Observations
Wildlife observations should all be completed within your site boundary. Use your completed field guide to demonstrate the types of wildlife you would like to have observed.

When designing your monitoring plan, a procedure will be implemented to count wildlife. You could, for example, count all wildlife observed throughout the duration of the monitoring session. Make sure you are consistently following the procedure you develop/use while counting and tallying wildlife. Once you have finished tallying all the observed species, you may circle the binned total if you choose to include bins on your final field sheets.
Take note if any dead animals were observed and if any threatened/at-risk/endangered species were observed. The box for at-risk/threatened or endangered species should only be filled in if the observer is confident of the species identification.
If you do choose to include this section in your field sheet, ensure that your field guide has a reference sheet that corresponds to the wildlife you plan to identify.
Trash and Waste Observations
Count all of the trash within your site boundary. Tally as you observe the litter, and once you have completed tallying, you may circle the appropriate bin (if you choose to bin the data).
For the repeat litter section, only fill this out if you know what the litter looked like during the last monitoring session. If nobody monitoring was there previously, disregard this section.
Sewage debris is a separate sub-section of the litter sheet that collects more precise sewage information. This is to identify when a combined sewed may have overflowed nearby. Tally this information the same as other litter information, but do not bin it at the end. In marine environments, we recommend only counting sewage debris up to 2 meters up from the high tide line.
Recreational Water User Information
You may choose to count the recreational water users for the entirety of the time you are sampling, or for a specific time period. Once you have finished tallying, you may circle the binned total if you choose to include bins on your final field sheets.
Use your field guide to help identify and define the water users you will be counting at each site.
The “How to fill out your field datasheets” video (LEFT) provides a step-by-step visual guide to completing your datasheet during monitoring.
Now that you have developed your documents and taken samples in the field, you’re ready to learn how to process and analyze your water samples! Section Four will specifically outline: lab preparation and safety, how to process samples, and how to conduct a sample analysis.
NEXT SECTION

