The rain effect: when sewage hits the Toronto Harbour

Sign out front of slip east of HTO Park, one of our sampling sites. Photo by: Lake Ontario Waterkeeper.
We’ve long known, and have said it many times, that whenever it rains, sewage flows into the Toronto Harbour. We have a combined sewer system in this city, meaning that stormwater and sewage collection flow through the same pipes on their way back to a wastewater plant for treatment. When it rains too much, however, the combined sewer system is overwhelmed, and the excess overflows straight into the lake rather than back towards the plant.
Toronto got hit hard by rain last week: 47.8mm between April 2-8 with a whopping 28.2mm on Thursday, April 6 alone.
Waterkeeper is currently sampling the Harbour every Wednesday. The significant rainfall over the previous two days—17.8mm between April 3 and 4—made an obvious impact on the water quality. We went out a day before the big rain last week.
As we did all winter, we sampled two locations: the slip east of HTO Park, at the Harbourfront Canoe and Kayak Centre, and Marina 4, the slip next to Purina PawsWay.

Green pin: HTO Park. Red Pin: Marina 4.
The water at HTO Park was fairly clear, the typical dark green colour of Toronto Harbour, and not a lot of particles. Samples from this location have shown relatively good water quality all winter. However, as the weather warmed this location has, more often than not, failed to meet Ontario guidelines for primary contact.
After collecting water samples, we bring them back to our office and process them in our in-house lab. The samples are ready for analysis in 24-48 hours. As is the standard around the world, we are looking for the number of E.coli colonies in our freshwater. E. coli is an indicator bacteria used to detect the level of fecal contamination in the water. They are considered a better indicator of human sewage than other types of bacteria because they are a primary bacterium found in intestines of warm blooded animals.
To determine the amount of E. coli in one sample, you count up all the blue and purple colonies that have emerged. Counting E. coli colonies were fairly simple for the samples taken from HTO Park, take a look:

Blue and deep purple "spots" represent E. coli colonies. You count those up to determine amount of E. coli in one sample. Photo by: Lake Ontario Waterkeeper.
E. coli colonies grew in every sample from HTO Park. The most we counted in one sample was nine. That’s nine times higher than what is considered ideal water quality for primary contact.
That sounds bad, but at least it passed Canadian guidelines for secondary contact, aka boating.
The results also have nothing on what we found with Marina 4. Take a look at the difference.
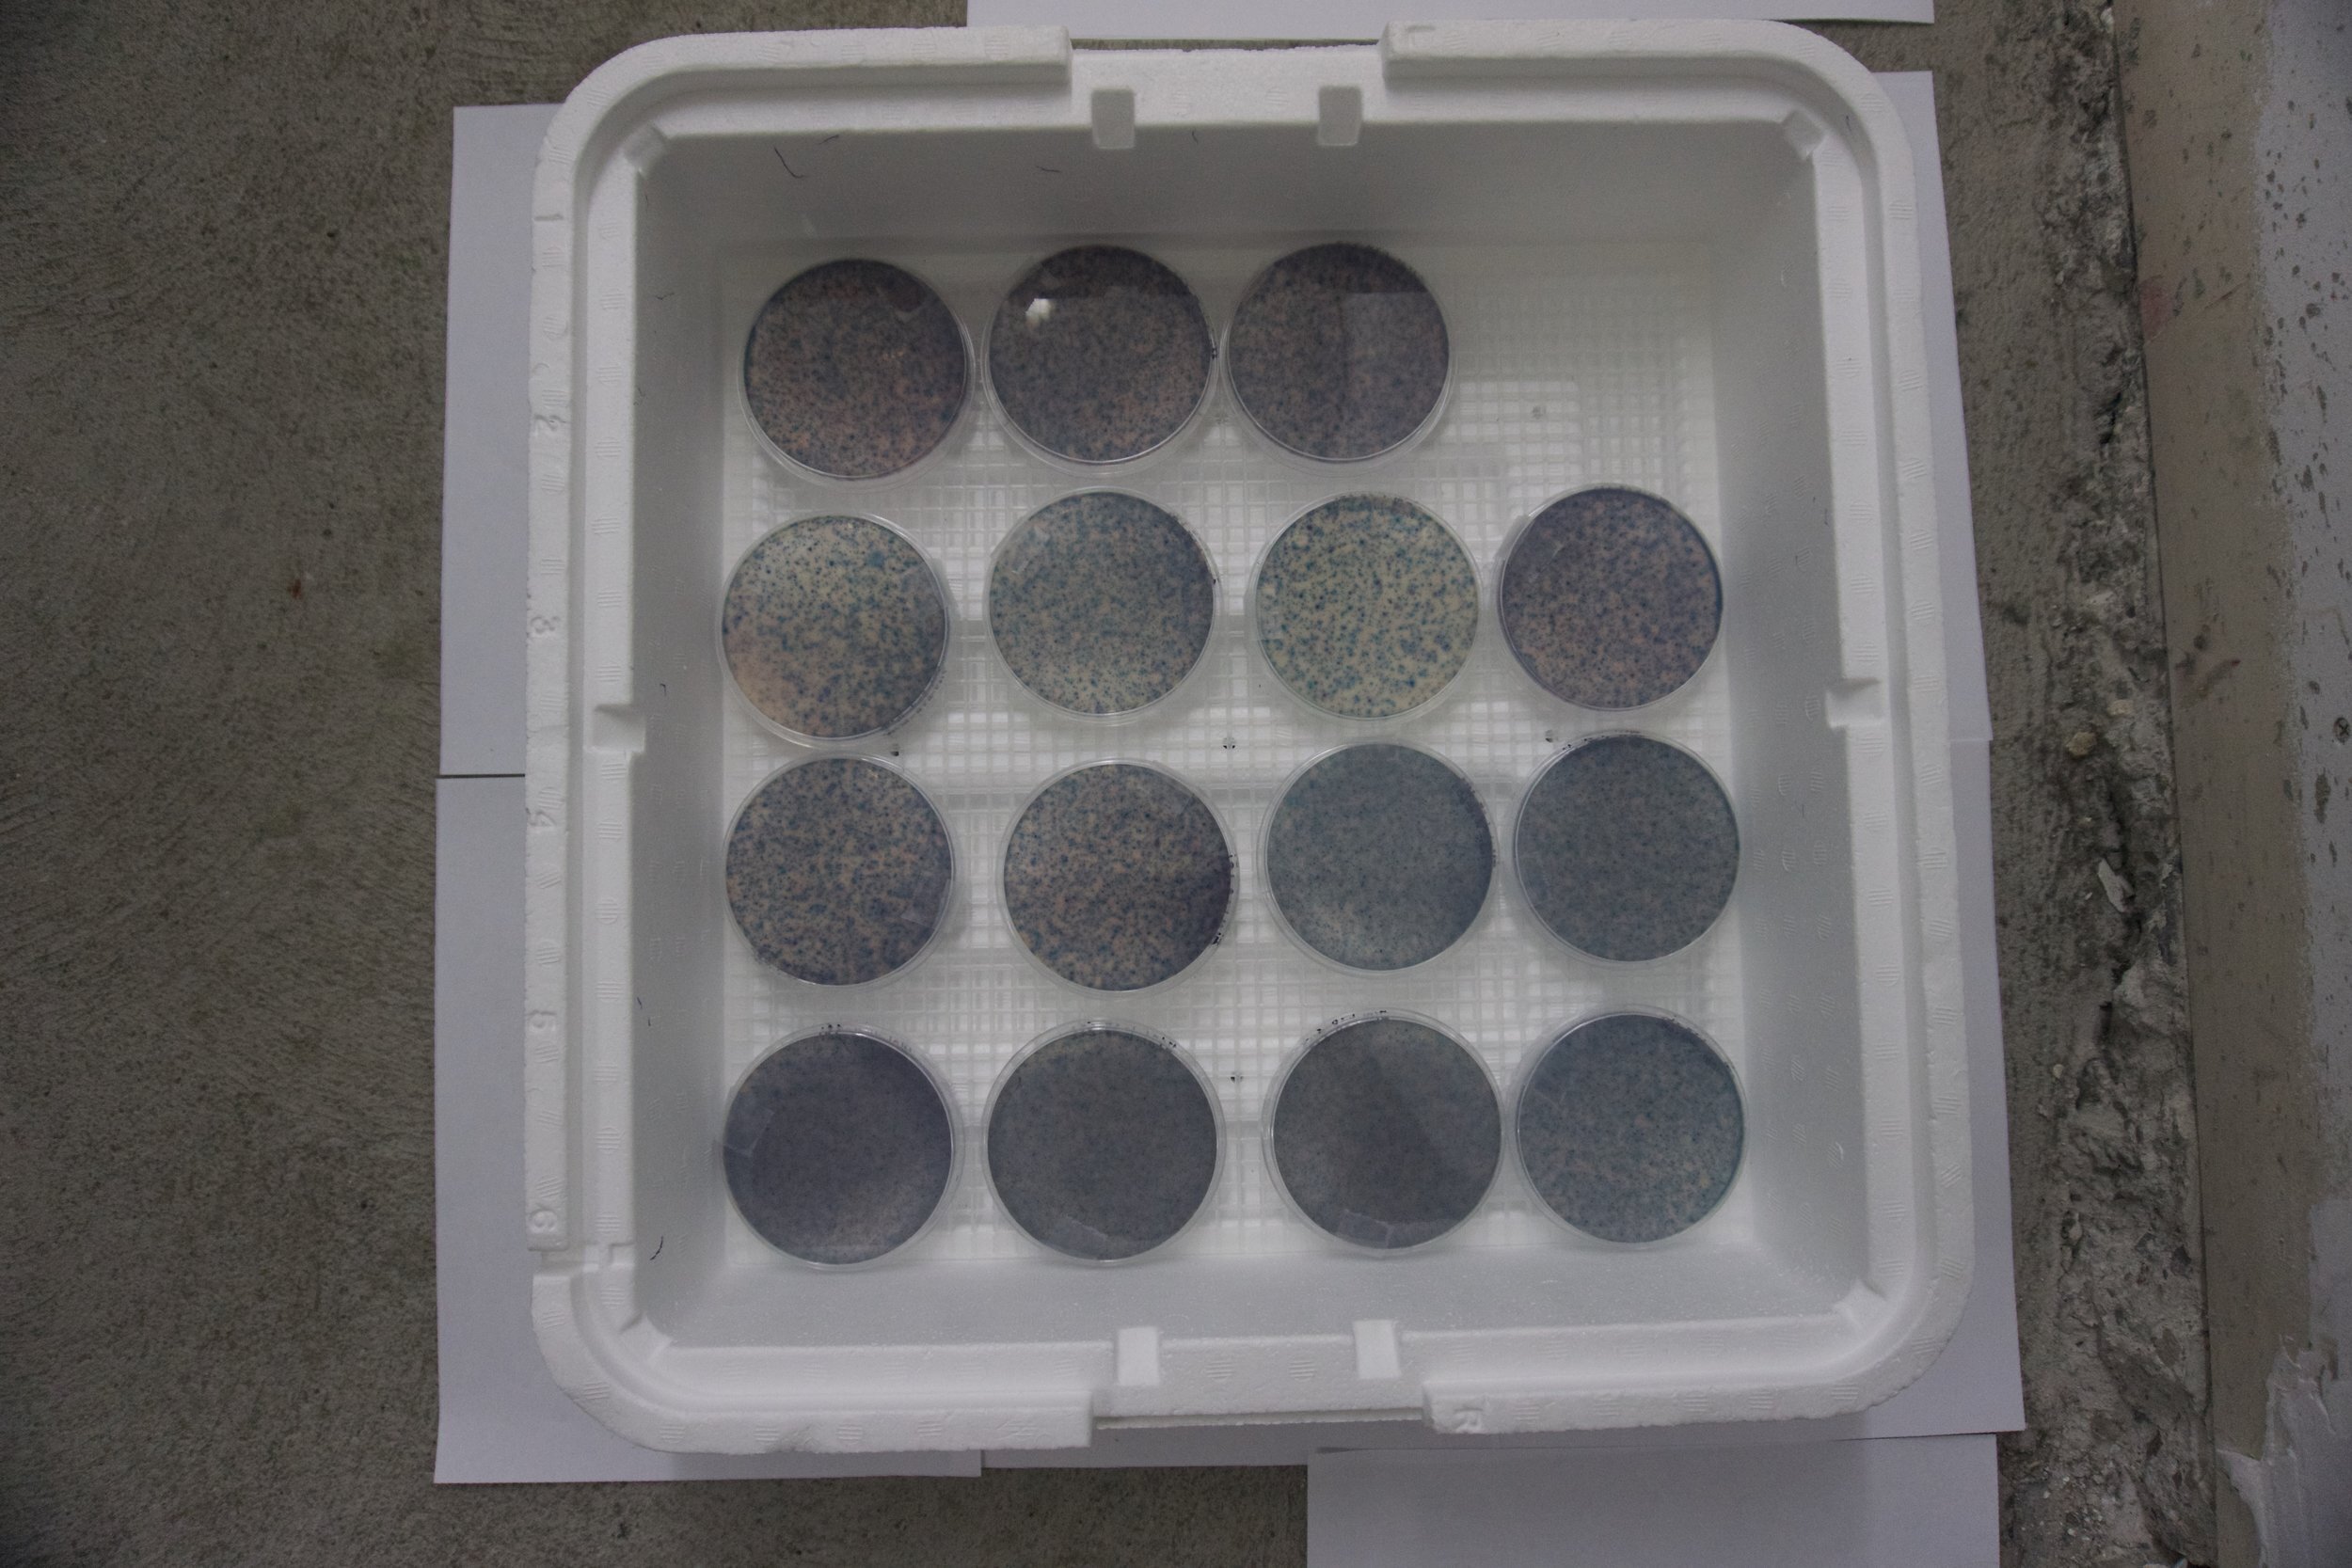
Photo by: Lake Ontario Waterkeeper.
Each petri dish was entirely covered in blue and purple E. coli colonies. Standard protocol for most samples dictates that petri dishes containing more than 300 colonies should be identified as TNTC (too numerous to count).
All samples from Marine 4 had greater than 300 E. coli/1mL. That converts to >30,000 E. coli/100ml, far exceeding the recommended federal and provincial guidelines for recreational water quality.
When we were out at the Harbour on April 5, we didn’t need to test the samples to know the water quality was bad. The water was brown and murky. In fact, you could smell the sewage.
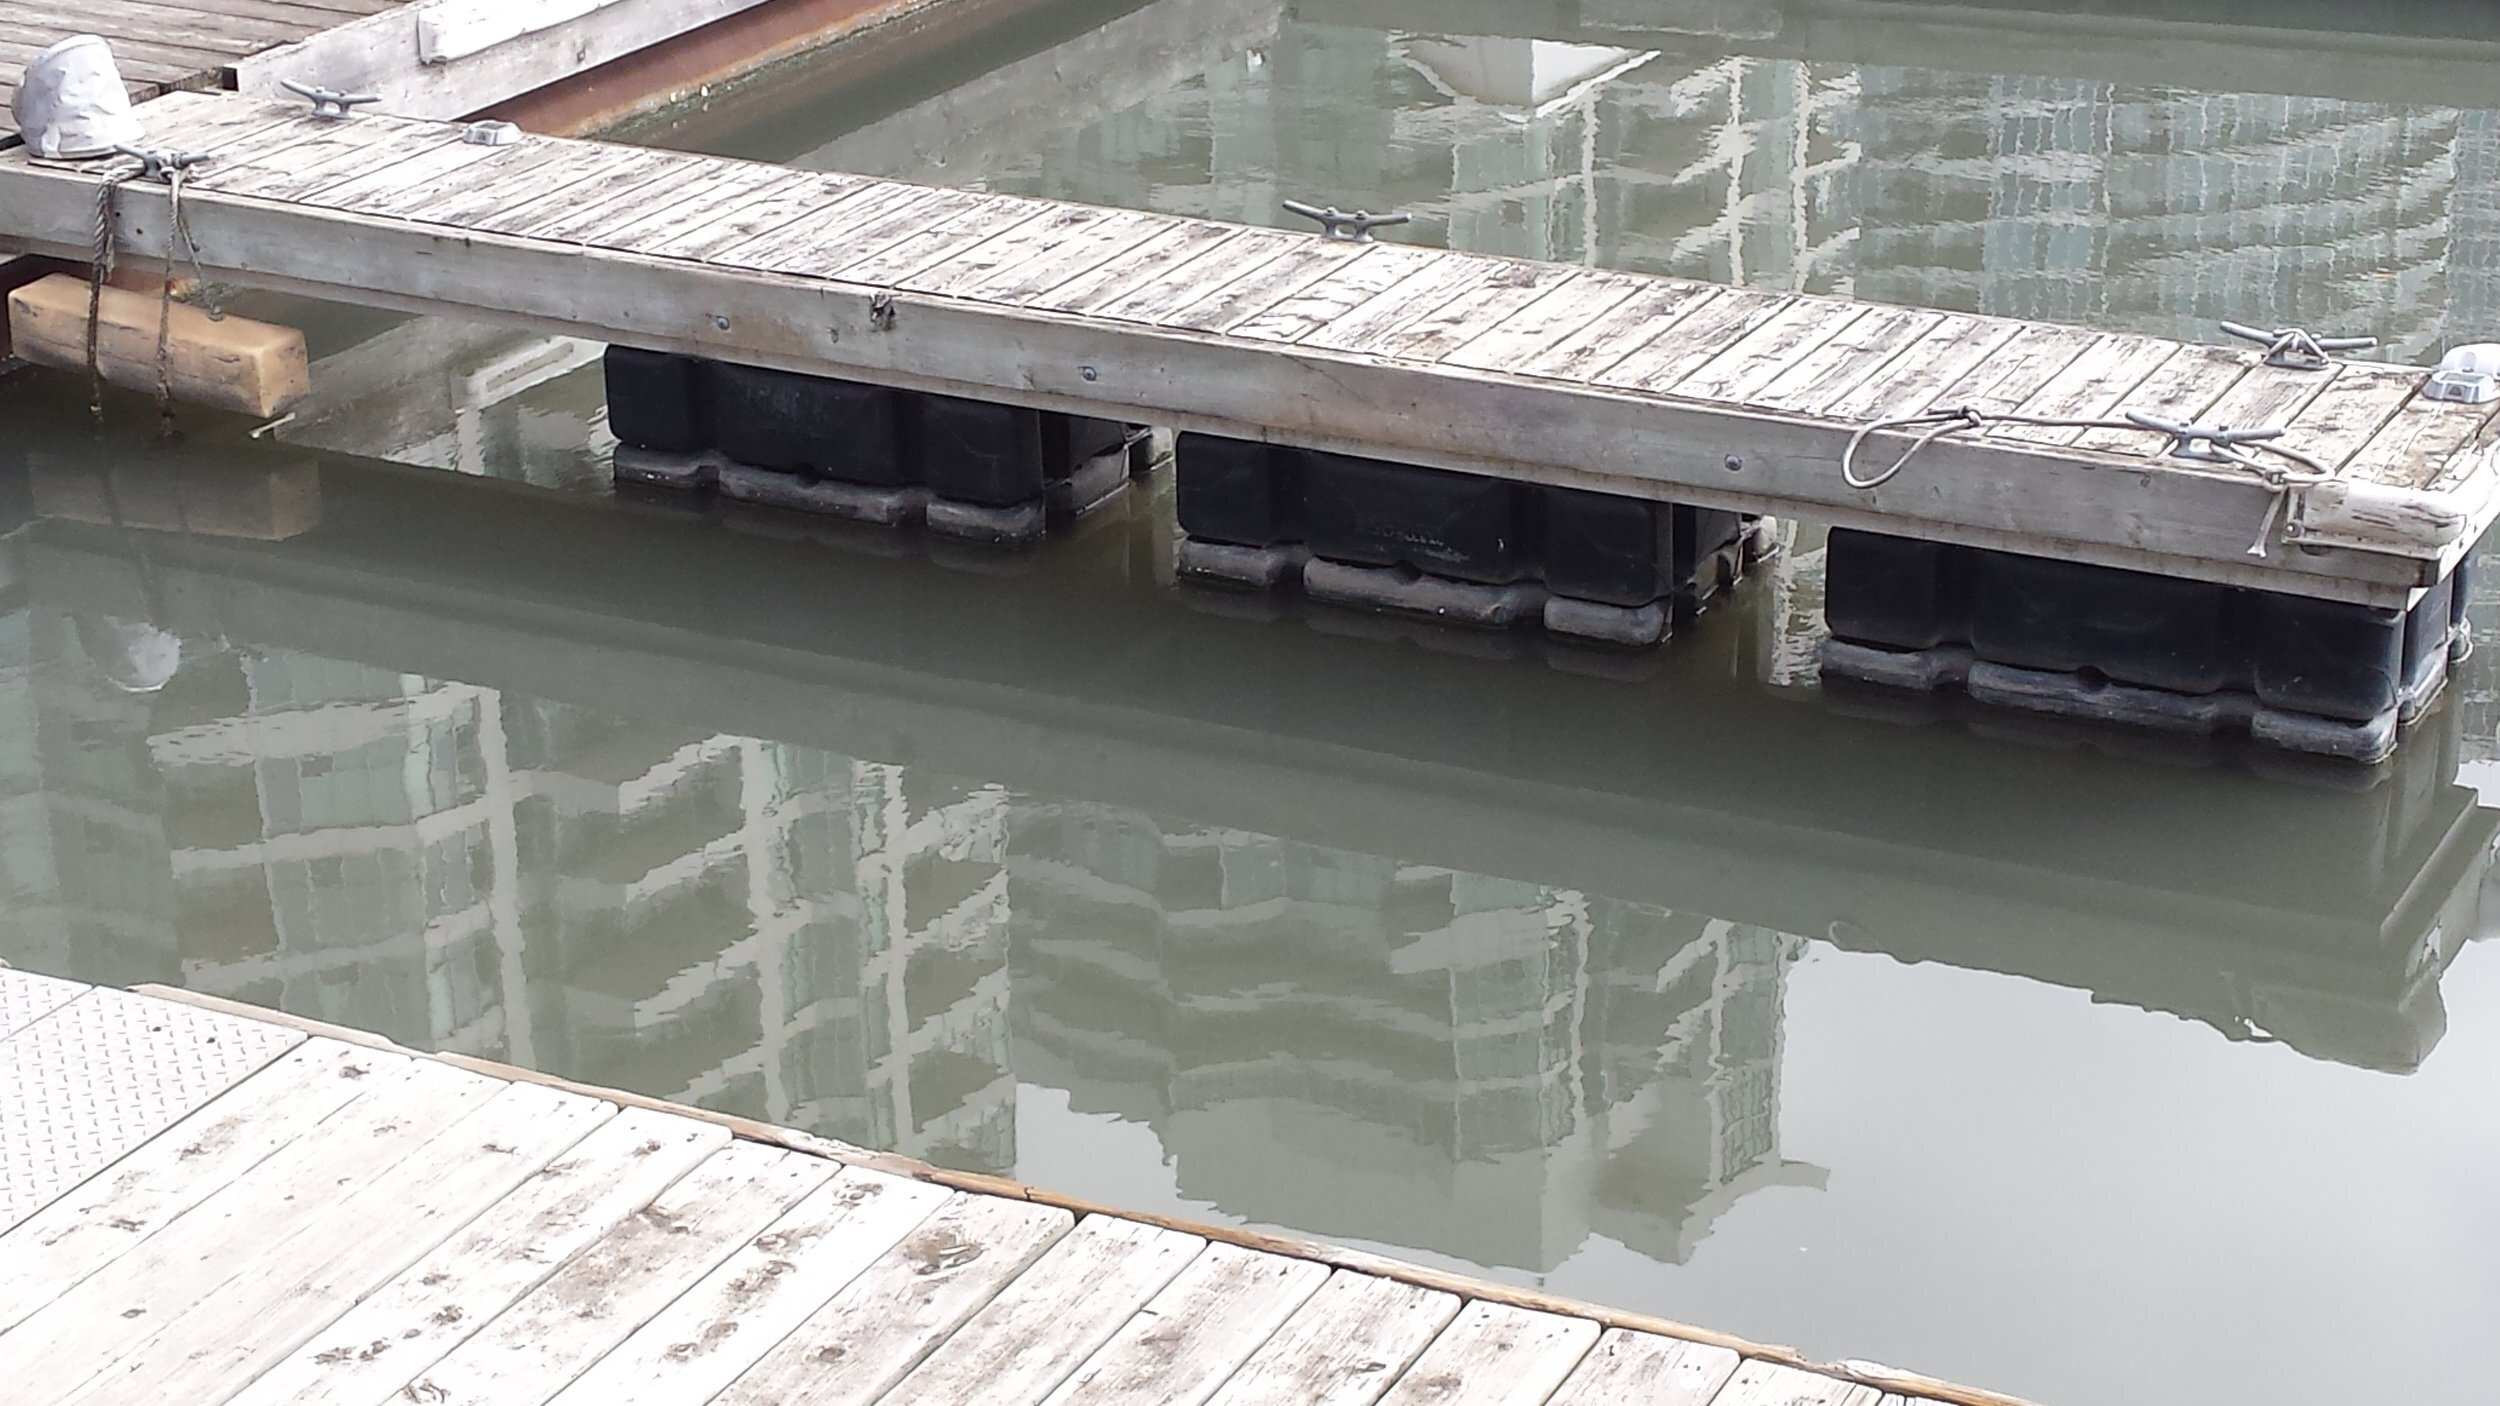
On a clean day, the water is typically dark green in colour. Photo by: Lake Ontario Waterkeeper.
Quite the difference between these two slips, made even more remarkable when you consider that they are practically beside each other, just a three minute walk separates them.
The photo below was taken from the CN Tower Cam at 9:14 am, just before we began collecting sampling at HTO Park.
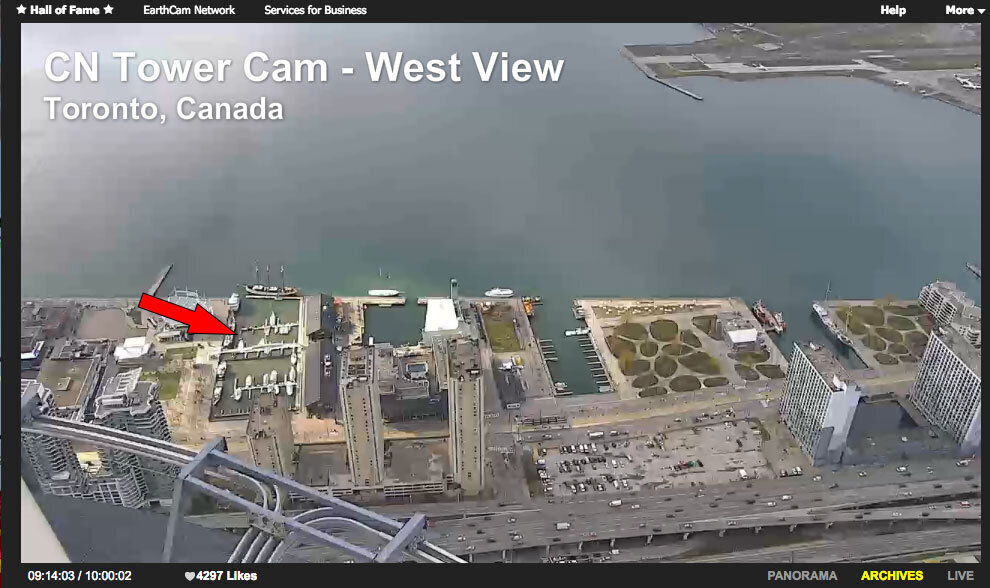
Arrow points to Marina 4. Note the brown-coloured water and compare with the rest of the lake.
Minutes later, you can see the brown plume coming out of Marina 4 and into the harbour.

And that brown plume continues to head out into the Harbour.

We know that there is a combined sewer overflow in this slip. It’s a reasonable conclusion that, when taking these photos and our samples into consideration, rain from the previous two days contributed to overloading the system, resulting in a sewage discharge.
Check out our Toronto Harbour Report for more on CSOs and sewage in the Toronto Harbour.
This is why sampling the Toronto Harbour is so important. This is why public alerts from the city should happen whenever there’s a rain event that overloads the system. Those are people’s boats sitting in that slip at Marina 4. It’s just a few minutes paddle away from the Canoe and Kayak Centre, the kind of boating that puts you right near the water.